Article
Active Monitoring: How Agentic AI Auto-Heals and Protects Enterprise Data Pipelines
Cross-posted. This article's canonical home is Data Lakehouse Hub.
Static alert thresholds work until they don't. You configure a row count alert for your daily orders table: fire if today's count is more than 20% below yesterday's count. The threshold is reasonable on average, but on Mondays after long weekends, Tuesday after a sales spike, and the first of every month when batch reprocessing runs, it fires false positives. After three months of false alarms, the team stops responding to alerts promptly. Then a real failure goes undetected for six hours.
The problem with static alerts is that they can't distinguish expected variation from genuine failure. Agentic monitoring systems can : because they reason about the cause of the deviation, not just the deviation itself.
Why Static Alerts Fail at Scale
Enterprise data platforms with hundreds of pipelines generate thousands of alert candidates per day. Static threshold alerts : row count drops, latency spikes, error rate increases, are cheap to configure and cheap to ignore.
The limitations:
No context awareness: A 15% row count drop on the orders table might be an upstream data loss, or it might be Monday. The alert fires either way. The on-call engineer has to investigate to distinguish them.
No correlation: A broken Salesforce API affects the CRM pipeline, which affects the customer model, which affects the revenue forecast, which affects the executive dashboard. Static alerts fire on each affected table independently. The engineer receives five separate alerts without knowing they have a single root cause.
No self-correction: When a static alert fires, it waits for a human response. If the human is unavailable, the problem persists. Static systems can detect failures but can't act on them.
Alert fatigue: When alert noise is high, signal detection degrades. Teams tune thresholds loosely to reduce noise and miss genuine failures.
The Agentic Monitoring Architecture
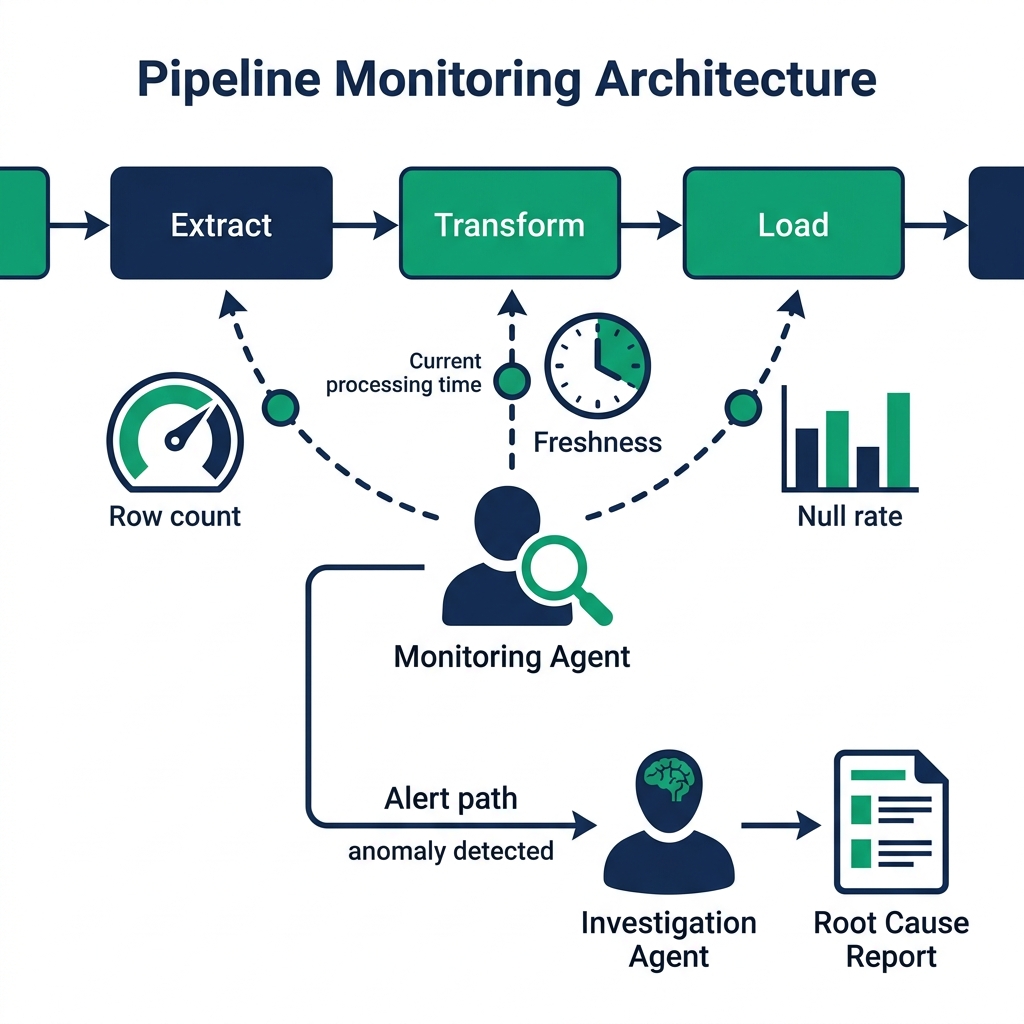
An agentic monitoring system replaces static threshold checks with a reasoning agent that investigates deviations autonomously.
The architecture has three components:
Metric collection: Regular execution of health check queries against each monitored table or pipeline. Row counts, null rates, maximum values, record freshness, processing latency. These run on a schedule : every 15 minutes for critical pipelines, hourly for less critical ones.
Deviation detection: Statistical comparison of current metrics against rolling baselines. Rather than fixed thresholds, the system uses learned baselines: the expected range for this hour of this day of the week, adjusted for recent trends. A 15% drop on Monday morning is different from a 15% drop on a Tuesday afternoon.
Agentic investigation: When the deviation detector flags an anomaly, an agent is invoked with the anomaly description and access to query tools. The agent investigates: it queries upstream tables to check whether source data arrived, checks error logs through SQL queries against a logging table, traces the lineage to identify which pipeline stages have run successfully, and determines the root cause.
The agent's investigation output is structured: root cause identified, severity assessment, affected downstream pipelines, and recommended action.
Anomalous Trace Analysis
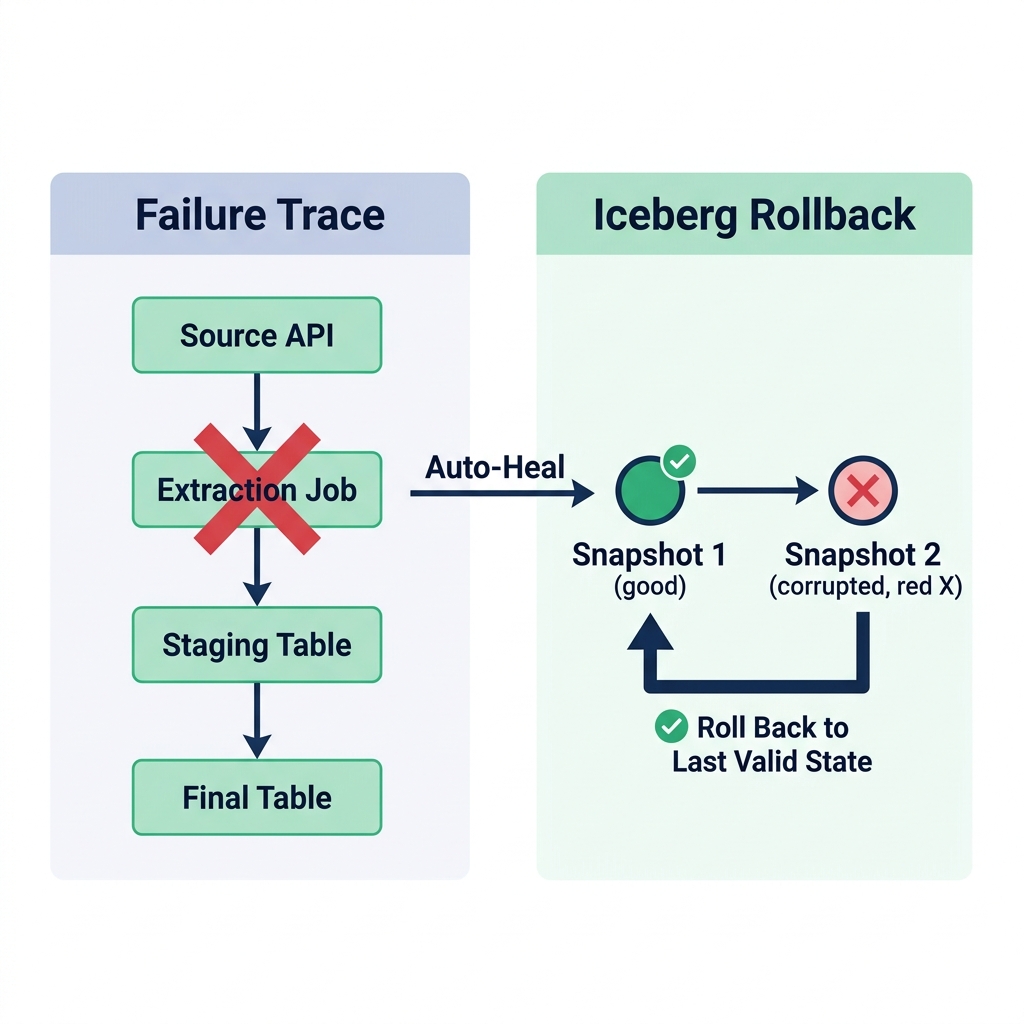
When an agentic monitoring system detects a pipeline failure, the investigation follows a trace pattern from the symptom backward to the source.
For a broken daily orders table, the agent traces:
- Check the staging table that feeds the orders table : did it receive records today?
- Check the source API extraction job log : did it complete successfully?
- Check the raw landing zone : are files present with today's timestamp?
- Check the extraction job error table : did any extraction attempts fail?
Each check is a SQL query against the relevant metadata or log table. The agent runs them in sequence, stopping when it finds where the chain broke.
This trace analysis takes 30–60 seconds in a well-configured system. A human engineer doing the same investigation manually typically takes 15–30 minutes, assuming they know the lineage well enough to know which logs to check.
Automated Rollback and Recovery
When the agentic system identifies a fixable failure : a stuck job, a missing file that needs to be re-fetched, a pipeline that needs a re-run from a checkpoint, it can take action without human intervention.
Automatic re-runs: If the investigation confirms that the pipeline failed due to a transient network error and the source data is still available, the agent triggers a re-run. It monitors the re-run and confirms success.
Checkpoint rollback: If a pipeline produced incorrect output (detected through data quality checks), the agent can roll back the Iceberg table to the last valid snapshot, remove the bad data, and trigger a corrective re-run. Iceberg's time travel capability makes the rollback operation safe : the previous valid state is available as a snapshot.
-- Rollback an Iceberg table to the last valid snapshot
ROLLBACK TABLE my_catalog.analytics.orders_daily
TO SNAPSHOT 7234567890123456789;
Notification with context: For failures that require human intervention (the source system is down, access credentials have expired), the agent generates a structured notification with the full investigation trace, the root cause diagnosis, the affected pipelines, and the recommended human action. The on-call engineer receives a complete diagnosis, not just an alert number.
Integrating with Dremio
Dremio tables managed through the Open Catalog support Iceberg time travel and snapshot management, which are the mechanisms agentic rollback relies on. An agentic monitoring agent connected to Dremio via the MCP server can:
- Query Dremio's metadata tables to check table health
- Examine snapshot history to identify when a table's content changed unexpectedly
- Execute rollback statements through the SQL interface
- Query pipeline log tables for error analysis
- Trigger Dremio's automatic table optimization jobs to clean up after a corrupted write
The combination of Dremio's semantic layer (for understanding what the data should look like) and Iceberg's snapshot management (for reverting to a known-good state) makes agentic auto-healing practical rather than theoretical.
The Limits of Autonomous Recovery
Agentic auto-healing is not appropriate for all failure modes.
When the root cause is external : a source system that changed its schema, a third-party API that returned corrupted data, a credential that expired, automatic recovery risks hiding the problem rather than fixing it. The pipeline re-runs, fails again, re-runs, and the cycle continues until human intervention.
Configure your agentic monitoring to auto-heal only for specific, well-defined failure patterns where automatic recovery is safe. For everything else, use the agent for investigation and notification, but require human approval before executing recovery actions.
Set a maximum auto-heal attempts counter (3 is a common limit) and escalate to pager alert after exhausting auto-heal retries. This prevents silent infinite loops where the agent keeps re-running a broken pipeline.
Building the Monitoring Knowledge Base
An agentic monitoring system gets better as it accumulates experience with your specific pipelines. Build a knowledge base that the agent can reference during investigations.
The knowledge base should contain:
- Known patterns: "Orders table always drops 30% on Mondays after long weekends. This is expected." The agent should recognize this pattern before flagging it as an anomaly.
- Dependency maps: Which pipelines feed which tables. If the agent knows that the revenue_forecast table depends on orders_daily, which depends on the Salesforce extraction job, it can jump directly to checking the extraction job when revenue_forecast fails.
- Recovery playbooks: "If the Salesforce API returns 429 rate limit errors, wait 2 hours and retry. Do not trigger an immediate re-run." Documented playbooks prevent the agent from taking counterproductive recovery actions.
- Escalation contacts: For each pipeline, who should be notified when auto-heal exhausts its retry limit.
Store this knowledge base in structured form : a table in Dremio or a YAML file the agent loads at startup. The agent reads the knowledge base before investigating any anomaly and uses it to contextualize its analysis.
Measuring Monitoring System Quality
Track these metrics to evaluate whether your agentic monitoring system is working:
Mean time to detect (MTTD): How long after a failure occurs does the system identify it? Target under 15 minutes for critical pipelines.
False positive rate: What percentage of alerts require no human action because the system flagged expected variation? If your false positive rate is over 20%, review and update your deviation detection baselines.
Auto-heal success rate: Of the failures where auto-heal was attempted, what percentage resolved without human intervention? A rate above 60% suggests good pattern coverage.
Mean time to resolution (MTTR): For failures that required human intervention, how long did resolution take? Agentic investigation should reduce MTTR by giving engineers a complete diagnosis immediately, rather than requiring them to build the investigation from scratch.
Try Dremio Cloud free for 30 days and build your first agentic monitoring workflow on top of your Iceberg data pipelines.