Article
Real-Time BI: Enabling Sub-Second Queries on Apache Iceberg Data Lakehouses
Cross-posted. This article's canonical home is Data Lakehouse Hub.
The standard knock on cloud object storage for analytics is latency. S3 GET requests average 20–50 milliseconds each. A dashboard query that scans 10,000 files issues 10,000 of those requests, which means 3–8 minutes of wall time before the analyst sees a result. That's not a BI experience : it's a batch report.
Sub-second interactive BI on Apache Iceberg is achievable, but it requires understanding which parts of the latency problem you're solving and which tools solve each part.
The Three Sources of Latency on Object Storage
File scan latency: Object storage is optimized for throughput, not random access. Reading many small files is slower than reading fewer large files, because each file requires a separate GET request with its own network round-trip.
Metadata scan overhead: Before reading data files, the query engine reads Iceberg metadata : the manifest list, then the manifests, then the file statistics. On a table with many snapshots and fragmented manifests, this overhead is measurable in seconds before any data is read.
Data transfer latency: Once the engine decides which files to read, it transfers them from the object store to compute memory. The transfer rate depends on the network bandwidth between the object store and compute nodes, and on whether any caching is in place.
Each source has a different solution.
Solution 1: File Layout Optimization
The cheapest way to reduce file scan latency is to stop creating small files in the first place, and to compact them when they accumulate.
Target file size for Iceberg tables optimized for analytical read workloads is 128 MB to 512 MB per file. Files smaller than 10 MB are a performance liability : they add metadata overhead and force the engine to issue more GET requests for the same amount of data.
Partition your tables by the column most commonly used in query filters. If 80% of your queries filter by region and date, partition by region and date. The Iceberg planner will skip files in non-matching partitions without reading them at all. A query against a table with 1 million files might only scan 5,000 files after partition pruning : effectively a 200x reduction in scan work.
For streaming data sources that write many small files continuously, run daily compaction to merge them. Dremio's Automatic Table Optimization handles this as a background job.
Solution 2: Columnar Cloud Cache (C3)
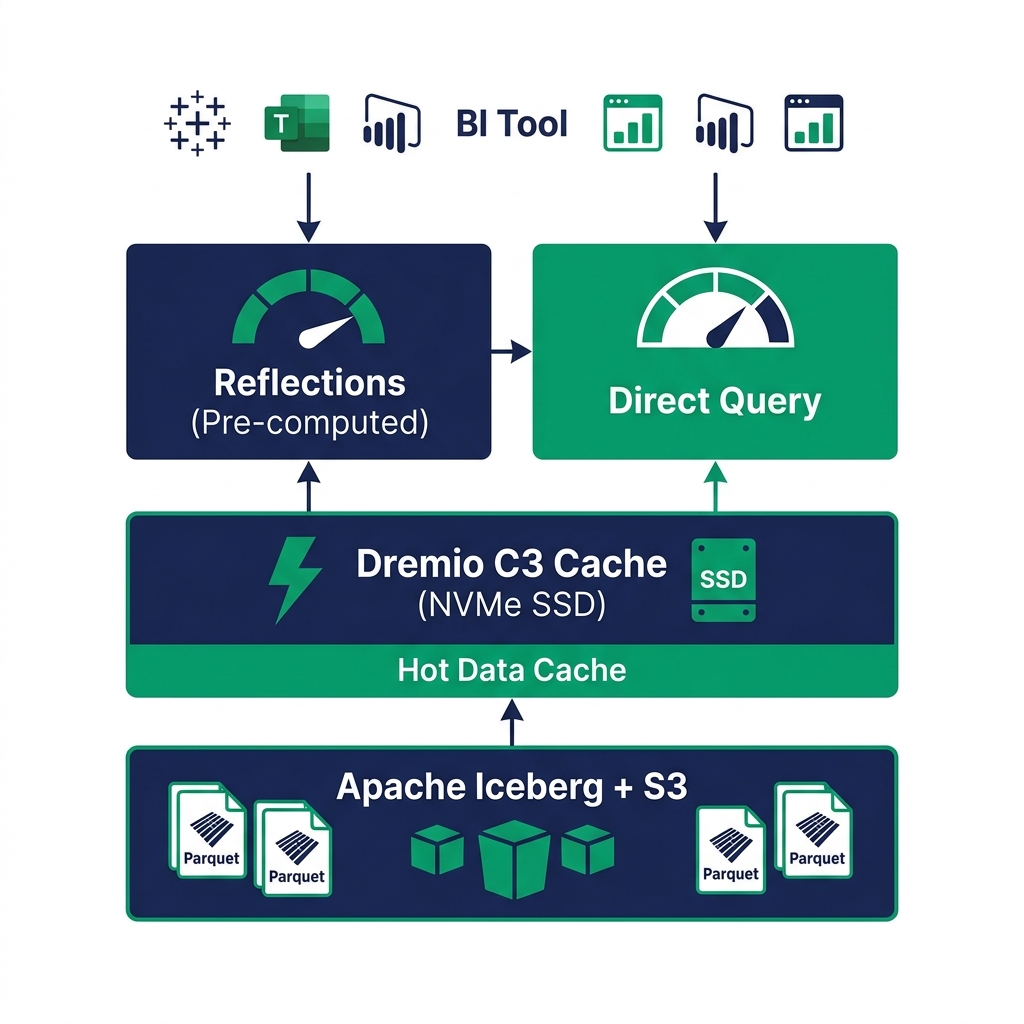
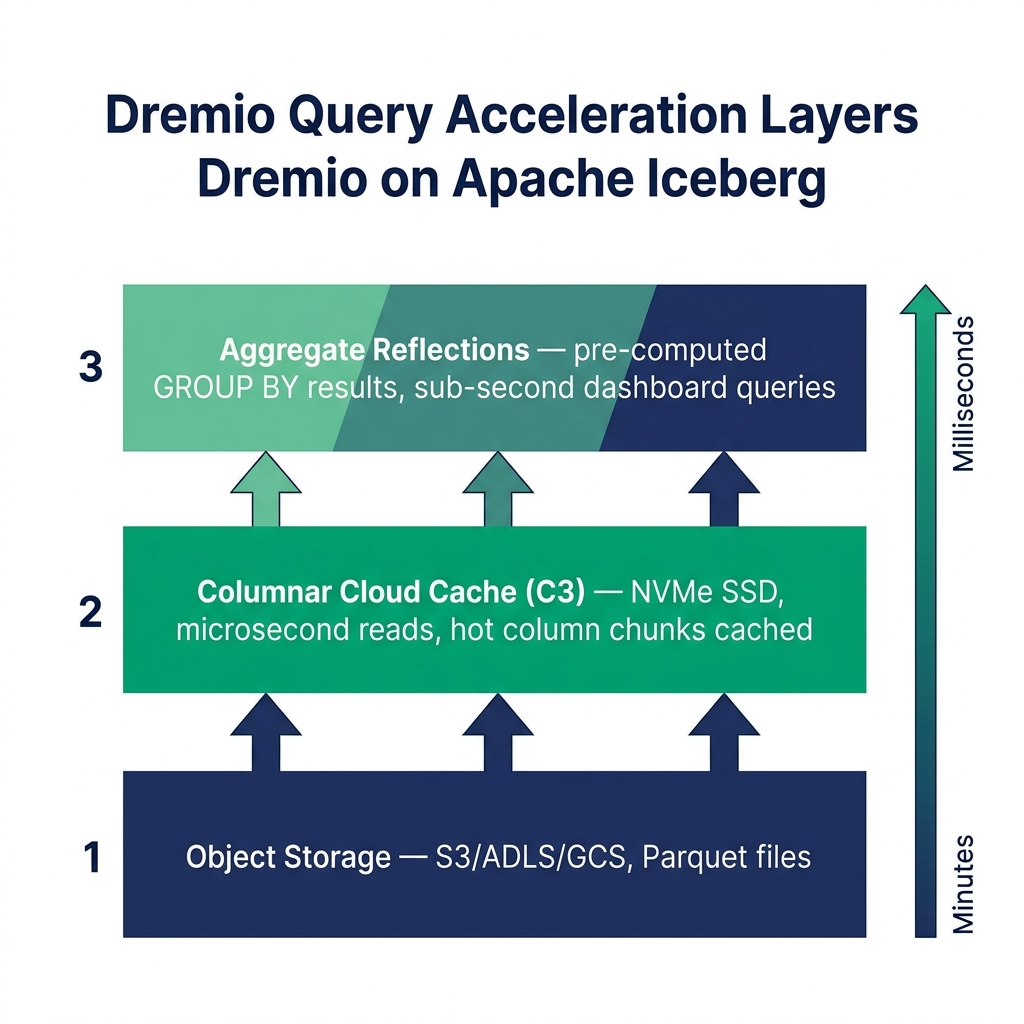
Dremio's Columnar Cloud Cache (C3) addresses data transfer latency by storing frequently-accessed data files on local NVMe SSDs at executor nodes. When a query requests a file that's in the cache, the engine reads from local disk instead of making an object storage GET request. Local NVMe read latency is measured in microseconds, not milliseconds.
C3 caches at the sub-file level: it stores the specific column chunks within a Parquet file that queries have accessed, not the entire file. A table with 50 columns where dashboards consistently read 5 columns will cache those 5 columns. Cache efficiency is high because columnar access patterns are predictable.
Cache hit rate depends on workload consistency. Dashboard queries that run the same report against the same time window every hour have near-100% cache hit rates after the first warm-up period. Ad-hoc queries across arbitrary date ranges have lower hit rates.
The tradeoff: NVMe storage at executor nodes costs more than object storage. Size the cache based on your active dataset : the data that users actually query in the last 30 days, not the full historical lake.
Solution 3: Reflections
Reflections are pre-computed, optimized copies of data stored as Iceberg tables. When a user runs a query, Dremio's optimizer checks whether a Reflection covers the query's requirements. If it does, the engine substitutes the Reflection transparently : the user's query against the full table returns results in milliseconds because it's actually reading from a small, aggregated Reflection.
There are two types:
Aggregate Reflections pre-compute GROUP BY aggregations. A monthly revenue by region query that normally scans 500 GB of transaction data might run against a 2 MB aggregated Reflection instead.
Raw Reflections create sorted, columnar copies of tables or views. They're useful for queries that can't be satisfied by pre-aggregated data but benefit from better sort order and file layout than the original table.
Autonomous Reflections take this further: Dremio monitors query patterns over a 7-day rolling window and automatically creates, refreshes, and drops Reflections based on observed access patterns. You don't have to identify which queries need acceleration : the system does it.
The key limitation of Reflections: they reflect data at the time of their last refresh. For near-real-time data, you need Reflections that refresh every few minutes, which adds cost. For data that's updated daily, a nightly refresh is sufficient. Match Reflection refresh frequency to your data freshness requirements.
Putting It Together: A Sub-Second BI Architecture
A practical sub-second BI architecture on Iceberg combines all three solutions:
- Write optimized files: Target 128-512 MB file sizes, partition by filter columns, run daily compaction on streaming tables.
- Cache hot data: Size C3 cache for the active 30-day dataset. Monitor cache hit rates and expand as needed.
- Accelerate dashboards: Create Aggregate Reflections for high-frequency dashboard queries. Enable Autonomous Reflections for the broader query workload.
- Maintain metadata: Run weekly manifest rewrites and snapshot expiration to keep query planning fast.
With this architecture, Dremio has demonstrated sub-second response times on Iceberg tables containing hundreds of billions of rows, for query patterns that Reflections cover. Cold queries on un-reflected data take longer, but even there, C3 and file layout optimization reduce latency from minutes to seconds.
What This Means for Your BI Stack
The biggest benefit of sub-second Iceberg queries isn't the speed itself : it's the tool compatibility. BI tools like Tableau, Power BI, Looker, and Superset expect query response times under 2 seconds for interactive use. When your data platform can't deliver that, analysts work around it by creating data extracts, local caches, and summary tables maintained separately from the canonical dataset.
Those workarounds are the precursors to data swamps. When the underlying platform delivers sub-second responses, analysts stop maintaining workarounds and work directly against the governed, canonical data.
Setting SLAs for Different Query Tiers
Not all queries need sub-second response. Building a tiered SLA model aligns your investment in acceleration with actual user expectations.
Tier 1 : Executive dashboards and operational metrics: Target sub-second response (under 1 second). Use Aggregate Reflections that refresh every 5–15 minutes. These are the queries your business depends on checking multiple times per day.
Tier 2 : Analyst self-service queries: Target under 10 seconds. Use Raw Reflections on commonly-queried tables and rely on C3 cache for warm queries. Analysts can tolerate a brief wait, but anything over 30 seconds breaks the investigation flow.
Tier 3 : Ad-hoc and historical analysis: Target under 2 minutes. No special acceleration, optimized file layout and partition pruning do the work. These queries run occasionally and analysts don't expect instant results.
Document these tiers explicitly and share them with your user community. Unrealistic expectations of sub-second response for complex historical queries create dissatisfaction even when the platform is working correctly.
Freshness and the Real-Time Tradeoff
Sub-second BI and real-time data freshness are in tension. Reflections that deliver sub-second response are snapshots of data at their last refresh time. A Reflection refreshed every 15 minutes has data that's up to 15 minutes stale.
For most BI use cases, 15-minute freshness is acceptable. Intraday revenue dashboards that update every 15 minutes are genuinely useful for business monitoring. Where freshness matters at a finer granularity : transaction monitoring, fraud detection, live operational dashboards, you need either very frequent Reflection refreshes or direct query paths against the most recent data files.
Dremio handles this through incremental Reflection refresh: instead of recomputing the entire Reflection from scratch, it reads only the new Iceberg snapshots since the last refresh and appends the new aggregates. An incremental refresh on a table that receives hourly updates takes seconds, not minutes, making 5-minute refresh intervals practical.
Try Dremio Cloud free for 30 days and measure your query latency improvement against your current Iceberg setup.